Canada’s economy faces an uncertain outlook as growth continues to slow, real estate markets are bottoming out, and distortions that accumulated during the pandemic are unwinding. These distortions include pent-up consumer demand and disrupted supply chains that are placing upward pressure on prices, with the Bank of Canada (BoC) raising its policy rate to 4.5% in response, an increase of 425 basis points from early 2022.[1] Unexpectedly high inflation was arguably the main macroeconomic theme of 2022, and the BoC’s success in tackling price growth will be a key determinant of Alberta’s economic performance in the coming period.
The macroeconomic picture outlined above places additional financial strain on Canadian households, especially those with high levels of debt or which have already encountered economic hardships during successive pandemic lockdowns. Many households do not appear well-placed to manage further stress, while it is increasingly apparent that these effects will not be felt evenly across the economy. For example, surveys from Statistics Canada find that 63% of households in the lowest income quintile were “very concerned about the impact of inflation on their ability to meet day-to-day expenses”, three times higher than those in the top quintile.[2]
The purpose of this in-depth note is to examine trends in household behaviour that emerged during the pandemic, and how the post-pandemic macroeconomic environment – including inflation and corresponding monetary policy decisions – are having varying impacts across different income quintiles. It is our estimation that these distributional effects will play an important role in public policy at the federal and provincial level in the coming years.
Income issues and trends in the past
Numerous publications have covered income disparities across different segments of Canadian society, with most pointing to growing income and wealth inequalities over time. For example, the Conference Board of Canada estimates that the median real income (adjusted for inflation) rose from $45,800 to $48,300 (5.5%) between 1976 and 2009, while average real income grew at a faster pace (16.8%) from $51,100 to $59,700 during the same timeframe.[3] This difference between median and average real household income growth suggests that individuals in higher income groups have been experiencing stronger relative earnings growth, with the Conference Board of Canada further estimating that the gap between the richest group and the poorest group widened from $92,300 to $117,500 over the same period. Consistent with this finding, a separate 2010 study from the Canadian Centre for Policy Alternative estimates that the share of income held by the richest one percent of Canadians has almost doubled from under 8% in 1977 to around 14% in 2007.[4]
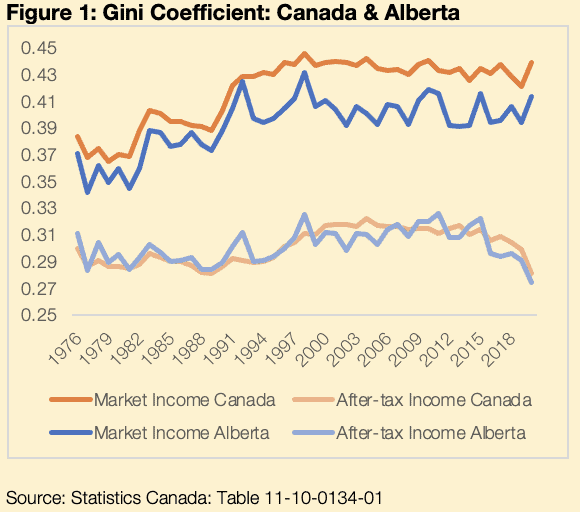
Income inequalities can also be tracked using the Gini coefficient which ranges in value from 0 (indicating perfect equality) and 1 (perfect inequality). Figure 1 sets out the Gini coefficient for Canada and Alberta, with the top two lines representing adjusted market income and showing that this has stayed relatively constant since 2000. Overall, the rise in market income inequality since the late 1970s stems from two main sources: 1) globalization and intensifying trade relationships has given a wage premium to workers with specialized skills in technology-intensive sectors, while at the same time lowering demand for labour in sectors that have been displaced by cheaper imports;[5] and 2) institutional forces such as declining unionization rates and stagnating minimum wages in some provinces have weighed on lower income groups more generally, while falling marginal income tax rates have been positive for higher earners.
The adjusted after-tax index (bottom two lines) also accounts for government transfers and marginal tax rates across income groups.[6] This measure of income is thus broader as it includes additional sources of non-market income; it is apparent that Canada’s progressive system of taxes and transfers successfully reduces some of these income gaps. In particular, from 2015 to 2019, the after-tax income coefficient decreased to its lowest level since 1989 despite little notable change in the market income coefficient over the same period.
Covid effects on household disposable income
Beyond its public health consequences, the COVID-19 pandemic was a major shock to Canada’s economy, entailing widespread job losses, businesses closures, and reduced household spending, especially on services. In 2020, there were 113,835 fewer individuals across Canada receiving employment income than in the previous year, with household labour income falling by an average of $1,600 (Bank of Canada, 2021). These labour income losses were especially pronounced for low-wage workers, with the number of positions earning less than $16 an hour falling by 27% in 2020.
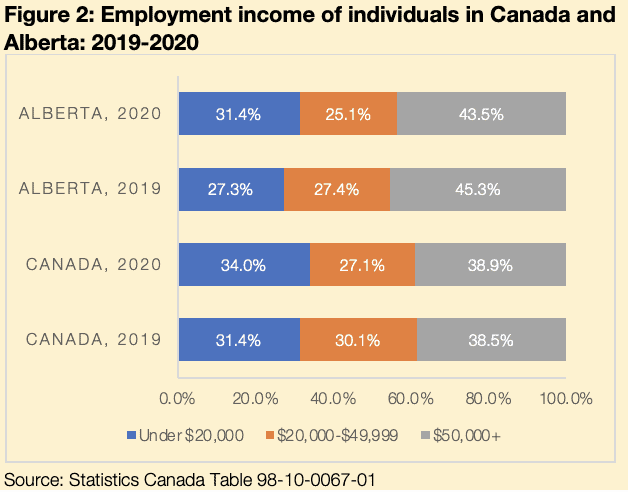
Furthermore, there were significantly fewer individuals earning employment income of $20,000-$49,999 in 2020 (5.7 million) compared to in 2019 (6.4 million). The province experienced similar trends, with 60,000 fewer Albertans earning $20,000-$49,999 in employment income in 2020 compared to the prior year (Figure 2).[7]
Despite these labour income declines during the early stages of the pandemic, emergency government transfers (e.g., CERB) were rolled out rapidly to labour market participants and business owners received support in the form of loans and subsidies. Between federal and provincial COVID-19 benefits, the average Canadian received $3,400, boosting her disposable income by $1,800 even as employment income fell.[8],[9] In fact, the bottom 20% of earners actually experienced a temporary rise in income as benefits exceeded pre-pandemic earnings (Bank of Canada, 2020). This trend is evident in Figure 1 as the Gini coefficient based on market incomes spikes upwards in 2020, whereas it turns downward based on after-tax incomes which includes social transfers and benefit payments.
The combination of higher government transfers and changes in consumer spending habits during the pandemic resulted in a $5,800 increase in average per capita savings in 2020 (Bank of Canada, 2022), resulting in a record-high savings rate and the value of personal deposits in banks increasing by $150 billion.[10] However, research by the Bank of Canada reveals that savings among different income quintiles was not equal: 37.2% of extra savings was acquired by the highest income quintile, whereas the corresponding figure for the lowest income quintile was just 9.2%.
Post-pandemic setting and policy pressures
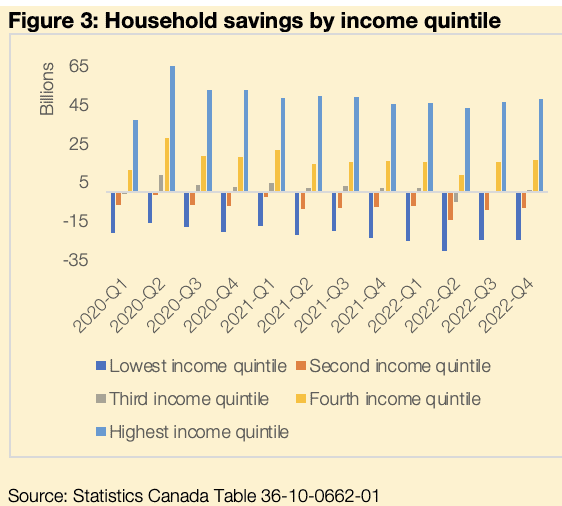
Many of the savings trends from the start of the pandemic have started to reverse: pandemic-related savings in the bottom two quintiles continued to fall in 2022-Q3 as inflation increased the cost of essential goods and services (Figure 3).[11] This comes as inflation in Canada (6.8% in 2022) and Alberta (6.4%) were markedly above the Bank of Canada’s 2% inflation target. Meanwhile, nominal wage growth continues to lag inflation, especially in Alberta where wages grew by 1.8% compared to a Canadian average of 4.7%.[12]These pressures have started to weigh savings accumulated during the pandemic, with the effects most noticeable for the bottom two household income quintiles who held a combined -$33 billion in 2022-Q4 (Figure 3).
Returning to the topic of income inequalities, we expect that the downward trend in after-tax income inequality experienced in 2020 was a temporary change caused by income supports during the pandemic. Since then, employment has returned to pre-pandemic levels and most major income support programs have since been phased out.[13] We expect these temporary effects to continue unwinding in the near term, while macroeconomic forces (e.g., interest rates, inflation) will likely contribute to greater inequality, especially as lower-income households remain in a vulnerable financial position.[14]
These dynamics have also taken centre stage in the run-up to the recent provincial election, with some of these challenges remaining top-of-mind for voters. This year’s provincial budget provides additional supports for lower-income households such as reducing Alberta Student Loan rates to the prime rate, indexing personal income tax brackets, and providing over $300 million to the Affordability Action Plan. The question remains whether these promised services will alleviate the pressures many Albertan households face, while there are risks that some pre-election giveaways might be clawed back now that the election has concluded. The sustained downward pressure on oil prices will also add pressure to rein-in spending: our rough calculations suggest that oil prices (WTI) at current levels of $70/bbl. –$9/bbl. lower than the budget forecast – would essentially erode all of this year’s expected surplus.[15]
Given these fiscal constraints, increasing access to social infrastructure is one initiative for policymakers to consider given is positive immediate and long-run economic returns. A large body of research finds that investment in social infrastructure positively impacts employment, productivity, and economic growth; while at the same time reducing inequalities by helping households at the lower end of the income distribution.[16],[17] Increasing access to childcare, in particular, has been linked to increased labour market participation and supports lower-income households.[18] The Canada-Alberta Early Learning and Child Care Agreement (effective as of January 2022) has been an especially positive recent development, introducing subsidies and grants to improve accessibility and affordability for households. This program helps lower-income families in Alberta by reducing out-of-pocket costs associated with childcare, increasing labour market participation as caregivers can rejoin the workforce; while it also frees up household budgets to spend on other areas.
Investing in social infrastructure has been found to provide positive long-run economic returns too. For example, social, language, and cognitive development in childcare can lead to improved school performance, higher probability of employment, higher incomes, and societal benefits (e.g., increased productivity, increased tax revenue generation).[19]While the full societal benefits of subsidized childcare can take years to materialize, it is a step in the right direction. Going forward, some consideration could be given to improving the program further, including better targeting these supports to lower-income families. [20]
At this stage, Alberta enjoys a position of relative strength as other provinces confront recessionary headwinds. However, with the phaseout of pandemic-related income supports, many households are left in a vulnerable position with diminishing (or even negative) savings and high interest rates adding to debt servicing pressures. Increasing affordability for lower-income families through accessible social infrastructure like childcare may be one of the ways in which policymakers can help place their most vulnerable households on a firmer footing.
[1] Bank of Canada main monetary policy instrument is through adjusting the target for the overnight rate on eight fixed dates each year.
[2] Rising Prices and the impact on the most financially vulnerable: A profile of those in the bottom family income quintile. Statistics Canada, February 2023.
[3] The Conference Board of Canada (n.d.). Canadian Income Inequality. Available at: https://www.conferenceboard.ca/hcp/caninequality-aspx/
[4] Yalnizyan, A (2010). The Rise of Canada’s Richest 1%. Available at: https://policyalternatives.ca/sites/default/files/uploads/publications/National%20Office/2010/12/Richest%201%20Percent.pdf
[5] According to the KOF Globalization Index, Canada has experienced increasing globalization since the 1970’s with the steepest increases occurring between 1988 and 2000. Since then, the rate of globalization lessened before declining slightly in 2020.
[6] After tax income is defined as total income less income taxes of the statistical unit during a specific reference period. Total income includes income from employment, investments, employer and personal pensions, other regular cash income, and income from government sources. Source: Dictionary, Census of Population 2016.
[7] Statistics Canada table 98-10-0067-01
[8] Direct fiscal support to households was $105 billion, equivalent to $3,400 per Canadian aged 15 and over. Considering the $1,600 decrease in labour income, disposable income rose by $1,800 for the average Canadian in 2020.
[9] Benefits considered in the study include the following income support measures: Canada Emergency Response Benefit, Canada Emergency Student Benefit, one-time federal transfer payments (e.g., GST tax credit), and provincial special transfers. Wages were also indirectly impacted by the Canada Emergency Wage Subsidy
[10] COVID-19, savings, and household spending. Bank of Canada. March 11, 2021.
[11] Poof Point: Canadians are still clinging to pandemic savings. RBC, January 24, 2023. Average savings per household among the bottom two income quintiles fell by 12% in Q3-2022 compared to Q1-2020. Savings in the top two quintiles were up by 28% in the same period.
[12] Source: Statistics Canada Table 14-10-0064-01
[13] CERB ended in September 2020 and CRB ended in October 2021.
[14] Gains in employment income for lower income earners (8.6%) were offset by a decrease in total income transfers received as pandemic income supports expired (15.0%).
[15] The interplay between energy prices and the provincial government’s revenues forecasts are somewhat more complicated than this illustration, with other variables (e.g., the US dollar exchange rate, the light-heavy differential, natural gas prices) also playing important roles in determining these effects. Nonetheless, the point stands that, ceteris paribus, lower WTI prices will have a negative effect on provincial government revenues.
[16] Boosting investments in social infrastructure in Europe. Fransen et al. December 1, 2017.
[17] National Institute of Advanced Studies: The Impact of Infrastructure Provisioning on Inequality. July 2018.
[18] The Benefits and Costs of Good Child Care: The Economic Rationale for Public Investment in Young Children – A Policy Study. Cleveland, G. and Krashinsky, M. March 1998. The cost-benefit analysis conducted does not include the benefit of additional employment for ECEs or the value of additional taxes collected from moving childcare out of the underground economy.
[19] Ibid.
[20] EndPovertyEdmonton suggests that families making $100,000 annually will experience a greater decrease in childcare costs under the new system compared to families making $40,000. A family in Edmonton making $40,000 a year would spend about 10% of their take-home pay on childcare (compared to 14% under the previous system). A family making $100,000 a year would spend about 6% of their take-home pay, down from 27% previously.